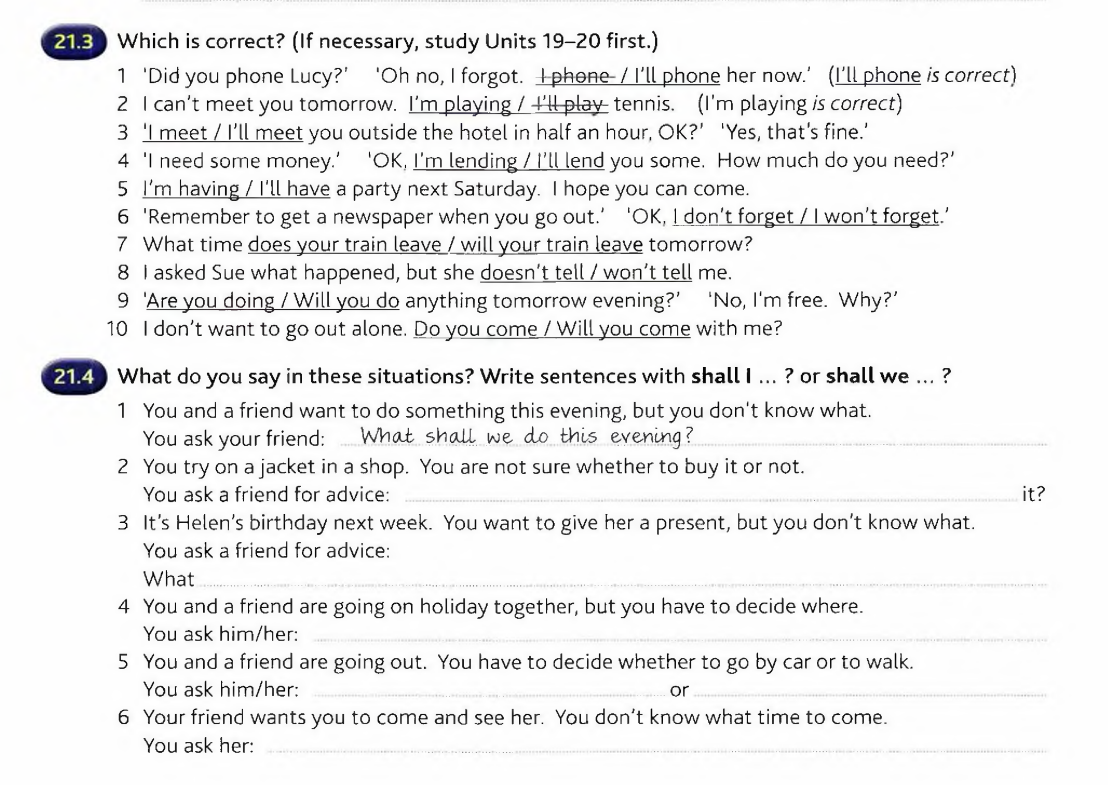
Today is the second class in your current four class set. We will start class with a casual conversation. Our reading this week is about recovery center staffing and our listening is about chart reading the stock market. I have included a transcript. For our mini grammar we will practice ‘’will and shall” sentences.
Click HERE for the reading
SYLVIE DOUGLIS, BYLINE: NPR.
(SOUNDBITE OF DROP ELECTRIC’S “WAKING UP TO THE FIRE”)
DARIAN WOODS, HOST:
There's a type of financial analyst who takes stock or bond price charts very seriously. They take out their pen, and they find patterns in the lines. They draw these pictures, and they give them names, like a top - that's where a stock price peaks before going down again. There is a head-and-shoulders pattern. That's another one, where the chart peaks a few times. And pay attention, because that is thought to signal a major reversal in a company's price.
MARY CHILDS, HOST:
This is called technical analysis or chart reading. It's been around in some form or another since at least the 1600s, and it's based on the idea that past company prices can help you predict future prices and then make money off that.
WOODS: Now, the academic evidence doesn't really support chart reading. These charts are not good predictors of the future. But yet, when you flick on the financial news, like CNBC -
(SOUNDBITE OF TV SHOW, "MAD MONEY")
JIM CRAMER: The VIX is making what looks like a head-and-shoulders formation.
WOODS: You see it.
CHILDS: You CNBC it.
WOODS: You CNBC it all the time.
CHILDS: (Laughter).
(SOUNDBITE OF MONTAGE)
BILL BARUCH: A beautiful cup and handle...
CRAMER: A bullish pennant pattern...
WOODS: There are shapes, and there are doodles that are hoping to help people get rich.
(SOUNDBITE OF TV SHOW, "MAD MONEY")
CRAMER: Is the golden cross is going to work its magic...
CHILDS: Cup and handle formation? The Ichimoku cloud? Chart reading is everywhere.
(SOUNDBITE OF MUSIC)
CHILDS: This is THE INDICATOR FROM PLANET MONEY. I'm Mary Childs.
WOODS: And I'm Darian Woods. Today on the show - why is chart reading so pervasive? We talk to a true believer, and we meet a true skeptic who found herself accidentally inspiring chart readers all over the world with her camel drawings.
The standard way that professionals decide to buy or sell stocks or bonds is by looking at a company's fundamentals. That means learning about the company's management, its strategy, its sales, its assets, and how all these things might fit into the wider economy. So if you take this information and a company looks cheap, then you should buy it. And if it looks overvalued, sell it.
CHILDS: But there is another way that some people decide how to trade. They basically take a ruler to a stock or bond price chart, and they draw some shapes. And they call it technical analysis.
WOODS: Helene Meisler has been working in financial markets for four decades, and she writes a column for realmoney.com.
HELENE MEISLER: I am always looking for patterns - be it in charts, in numbers - everywhere.
WOODS: In 1989, Helene was hired as the first person at Goldman Sachs to specialize in chart-reading techniques. Nowadays, it's definitely not mainstream at big firms like Goldman Sachs, but you do see chart reading analysis at big firms from time to time. And we should say that Helene complements her chart reading with other information, like surveys of sentiment and economic indicators and industry news. But she strongly believes in the validity of chart reading as one tool. Every day, she writes out by hand the ways that companies' stock prices are moving.
MEISLER: There is a certain feeling you get from putting the pencil to the paper. I might not remember stock prices all the time. But if you ask me about a stock chart that I post by hand, I've got that pattern in my head, and I pretty much know what that pattern looks like.
WOODS: Oh, really? What if I asked you about - I don't know - semiconductor companies?
MEISLER: The semiconductors, as a whole, have been just trading back and forth for about two weeks now. They're not even close to the August highs.
CHILDS: This is what chart readers call a resistance level - like a ceiling. The stock price just can't seem to get past a certain number. In the chart-reading world, this is not a good sign, which Helene says is because of mass psychology.
MEISLER: People trade stocks. And so you have to take that human emotion and put it into stocks because we always get scared at lows, and we get excited at highs. I mean, it's - that's just human nature.
CHILDS: So to take the semiconductor example, maybe a bunch of investors held semiconductor shares when the market tanked earlier this year. And instead of selling, the investors held on. They didn't want to come to terms with the loss in value. They said to themselves, I'll sell it once the price recovers. And this is a real psychological phenomenon. It's loss aversion. We tend to hate losses more than we value gains.
WOODS: And loss aversion could explain a stock price that can't seem to reach past a ceiling. Like, once you've reached that point, maybe there's a bunch of those people who said they'd sell once it got to a certain level, and they're finally selling.
CHILDS: The trouble is, you could tell a bunch of plausible stories using psychology or market structure, and you could plausibly reach other conclusions. You know, in this semiconductor example, you could come to the conclusion that share prices are going to rise instead.
WOODS: So how do you guard against knowing what is a real pattern and just a trick of the mind? I mean, I see patterns that aren't necessarily related. Like, I might see - I don't know - a bunch of red cars in a row on the street...
MEISLER: (Laughter).
WOODS: ...But I know that that's just a coincidence. How do you disentangle coincidences from something that might be real?
MEISLER: Yes. I am - I notoriously see head-and-shoulders patterns, bottoms and tops in every chart. I just do. And whether or not they work out is a whole nother story. But it's just how my mind works.
CHILDS: Academics in finance have pored over stock market and bond market data, and the evidence is not looking good for chart readers. Like, just because a stock was doing well on Monday and Tuesday - it has no relationship with whether it'll do well on Wednesday. Like, if you're flipping a coin, and you get a hot streak of getting heads, it doesn't mean that it's going to be heads the next coin toss.
WOODS: Another critique of chart reading is - when do you start the graph? Like, what timeline do you use? You know, what looks like a huge cliff - like a plummeting over five days, say - actually looks pretty small if you extend the timeline out to a year. And it raises the question - like, what pattern should you focus on?
CHILDS: Now, the odd study has found evidence in favor of the chart readers some of the time. But most academics are very skeptical, and so is the markets editor for the Financial Times.
WOODS: I just spoke to Katie Martin from the FT, and she kind of popularized this vomiting camel shape.
MEISLER: (Laughter) I love that.
WOODS: Have you heard of this?
MEISLER: I love that. Yes, I've seen her do that. Yes.
WOODS: What do you think about the vomiting camel and the kind of conversations that it's provoked?
MEISLER: Well, first of all, I just think it's very funny. Basically, to me, this is my impression - is a vomiting camel is just a stock that spilled over and kind of died. You know, it's just where people finally give up and - boom - just sell that stock.
KATIE MARTIN: The whole thing is very obviously, to my mind, a joke.
CHILDS: That is Katie Martin. She is the Financial Times editor we mentioned. And let's just pause for a second to explain the vomiting camel thing.
WOODS: Yes, please do the vomiting camel explaining, Mary. I've been waiting my whole life for this.
CHILDS: Let's do it. We should.
In 2014, Katie wanted to highlight what she thought was the absurdity of chart reading. So she borrowed an idea that she'd seen on the internet and started drawing a new shape over chart after chart. So she's tracing the peaks in price, going up and down and up and down and down again. And when she looked at it, she saw a vomiting camel - very clearly - a camel that is throwing up - a puking camel.
WOODS: Not in a good place. This camel is not in a good place.
CHILDS: No, it's bad. It's really a bad - it's - get out. It's - sell your stocks. You should have already sold them, you know, in the neck portion of the camel...
WOODS: Yeah (laughter).
CHILDS: ...You know - or the hump even, you know?
MARTIN: I thought it was just flat-out funny that you could see this, you know, stupid pattern that had been, like, crudely drawn on with, like, MS Paint or something over the top of this chart to make it look like a vomiting camel.
WOODS: But a few years later, crypto-trading YouTubers started taking the vomiting camel seriously.
(SOUNDBITE OF VIDEO)
UNIDENTIFIED PERSON #1: This is called a vomiting camel pattern. And this is real, by the way.
UNIDENTIFIED PERSON #2: Really?
UNIDENTIFIED PERSON #1: I'm not even joking. This is actually real.
UNIDENTIFIED PERSON #2: OK.
UNIDENTIFIED PERSON #1: This happened with gold, I want to say, in 2014.
MARTIN: Yeah, I just didn't get the joke at all.
WOODS: It's like "War Of The Worlds," where people thought there was really an alien invasion, but for financial markets.
MARTIN: (Laughter) Yes.
CHILDS: Katie does concede that there might be some situations when chart reading does work. Like, if everyone believes that a certain pattern means that there is going to be a rally, then that could be a self-fulfilling prophecy. But overall, she just says it doesn't make sense to her.
MARTIN: I don't want to spoil people's fun. And I know that people have made money out of this, and that's fine. That's great. That's up to them. But, you know, it does make me slightly uncomfortable that you see lots of sort of tutorials online that say, you know, this is a sure-fire way to make money out of markets. If this chart is doing this, it's definitely going to do this next. That's rubbish. There are no certainties in this business, and you have to take that sort of thing with a massive pinch of salt.
(SOUNDBITE OF MUSIC)
WOODS: This show was produced by Kathryn Yang, Corey Bridges and Nicky Ouellet. It was engineered by Robert Rodriguez. It was fact-checked by Sierra Juarez. Viet Le is our senior producer, and Kate Concannon edits the show. THE INDICATOR is a production of NPR.
(SOUNDBITE OF MUSIC)